Online rumblings from GOP stalwarts on my social media suggest that the numbers of Covid-19 cases are a reflection of politics. Red States are faring better than Blue they insist. My protests that this involves transportation hubs and population density is countered by a list comparing neighboring states. It goes something like this.
“It must be noted here that Indiana and Ohio have much lower death rates than MI. In fact when you compare nearly every Democrat run state with its Republican run neighbor you see the same result. MA v CN [sic] or NY, CO and NV v UT, WA v ID, SD v MN, TX, AR, and AL v LA. VT vs NY. OH v PA, MD v PA, NV v AZ, CA v AZ (although these are close but with Los Angeles climbing rapidly, it may separate out more), VA v WV.”
The President has joined in on this partisan finger pointing, jumping on every possible opportunity to blame Democratic Governors for the cases in their states.
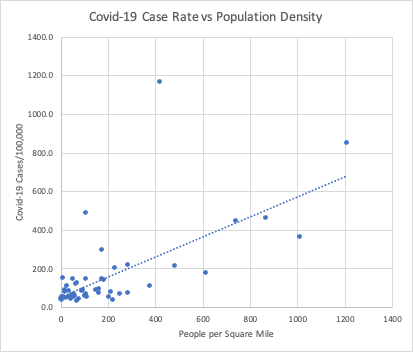
Tired of all this sloppy epidemiology, I decided to put this to a relatively simple test. I took a standard statistical model to look at the relationship between the number of cases per 100,000 people in every state and three things, politics, air travel, and population density. The political party of the Governor and the percent of the state’s popular vote won by Trump in 2016 were my surrogates for political leaning. Air travel was estimated using the number of flights per day into the state (not an ideal measure, but a good start). The number of people per square mile described the population density (although it doesn’t necessarily capture the density of a states large cities).
The model considered all of these variables at once. Only one mattered. Population density. Politics and air traffic explained nothing, not even close. The number of people per square mile in a state accounted for 45% of the variability in disease rates. If we take New York out of the mix, which is a huge outlier, that number increases to 65%. And that doesn’t consider any other factor such as the nature of a state’s lockdown policies, when the state saw its first case, or the frequency of international flights.
On one end of the spectrum, you have New Jersey with 1,208 people per square mile and 848 cases per 100,000. On the other is Alaska with 1.2 people per square mile and 41 cases per 100,000. This didn’t happen through any great political acumen on the part of Alaska’s politicians, it happened through one thing. The ultimate social distancing measure. No people. If you could spread everyone in Alaska evenly across the state, they would be almost a mile apart. In New Jersey they’d be 150 feet apart. With 100 times the density, it’s not surprising they have 20 times the incidence.
Political party of the Governor and percent of Trump voters had absolutely, categorically no impact. To be more precise, there is an 85% chance that the association between percentage of Trump voters and Covid-19 incidence rates is completely random. The chance that that population density is unrelated to incidence is 0.2%. If we exclude New York, that drops to 0.00003%.
It is time to bury the political hatchet. The Blue and Red paint that has been splattered across this story is killing people. The media warriors need to stand down. The “color” of your state is irrelevant. What matters is compassion and respect for our common humanity. It is time to pull together.