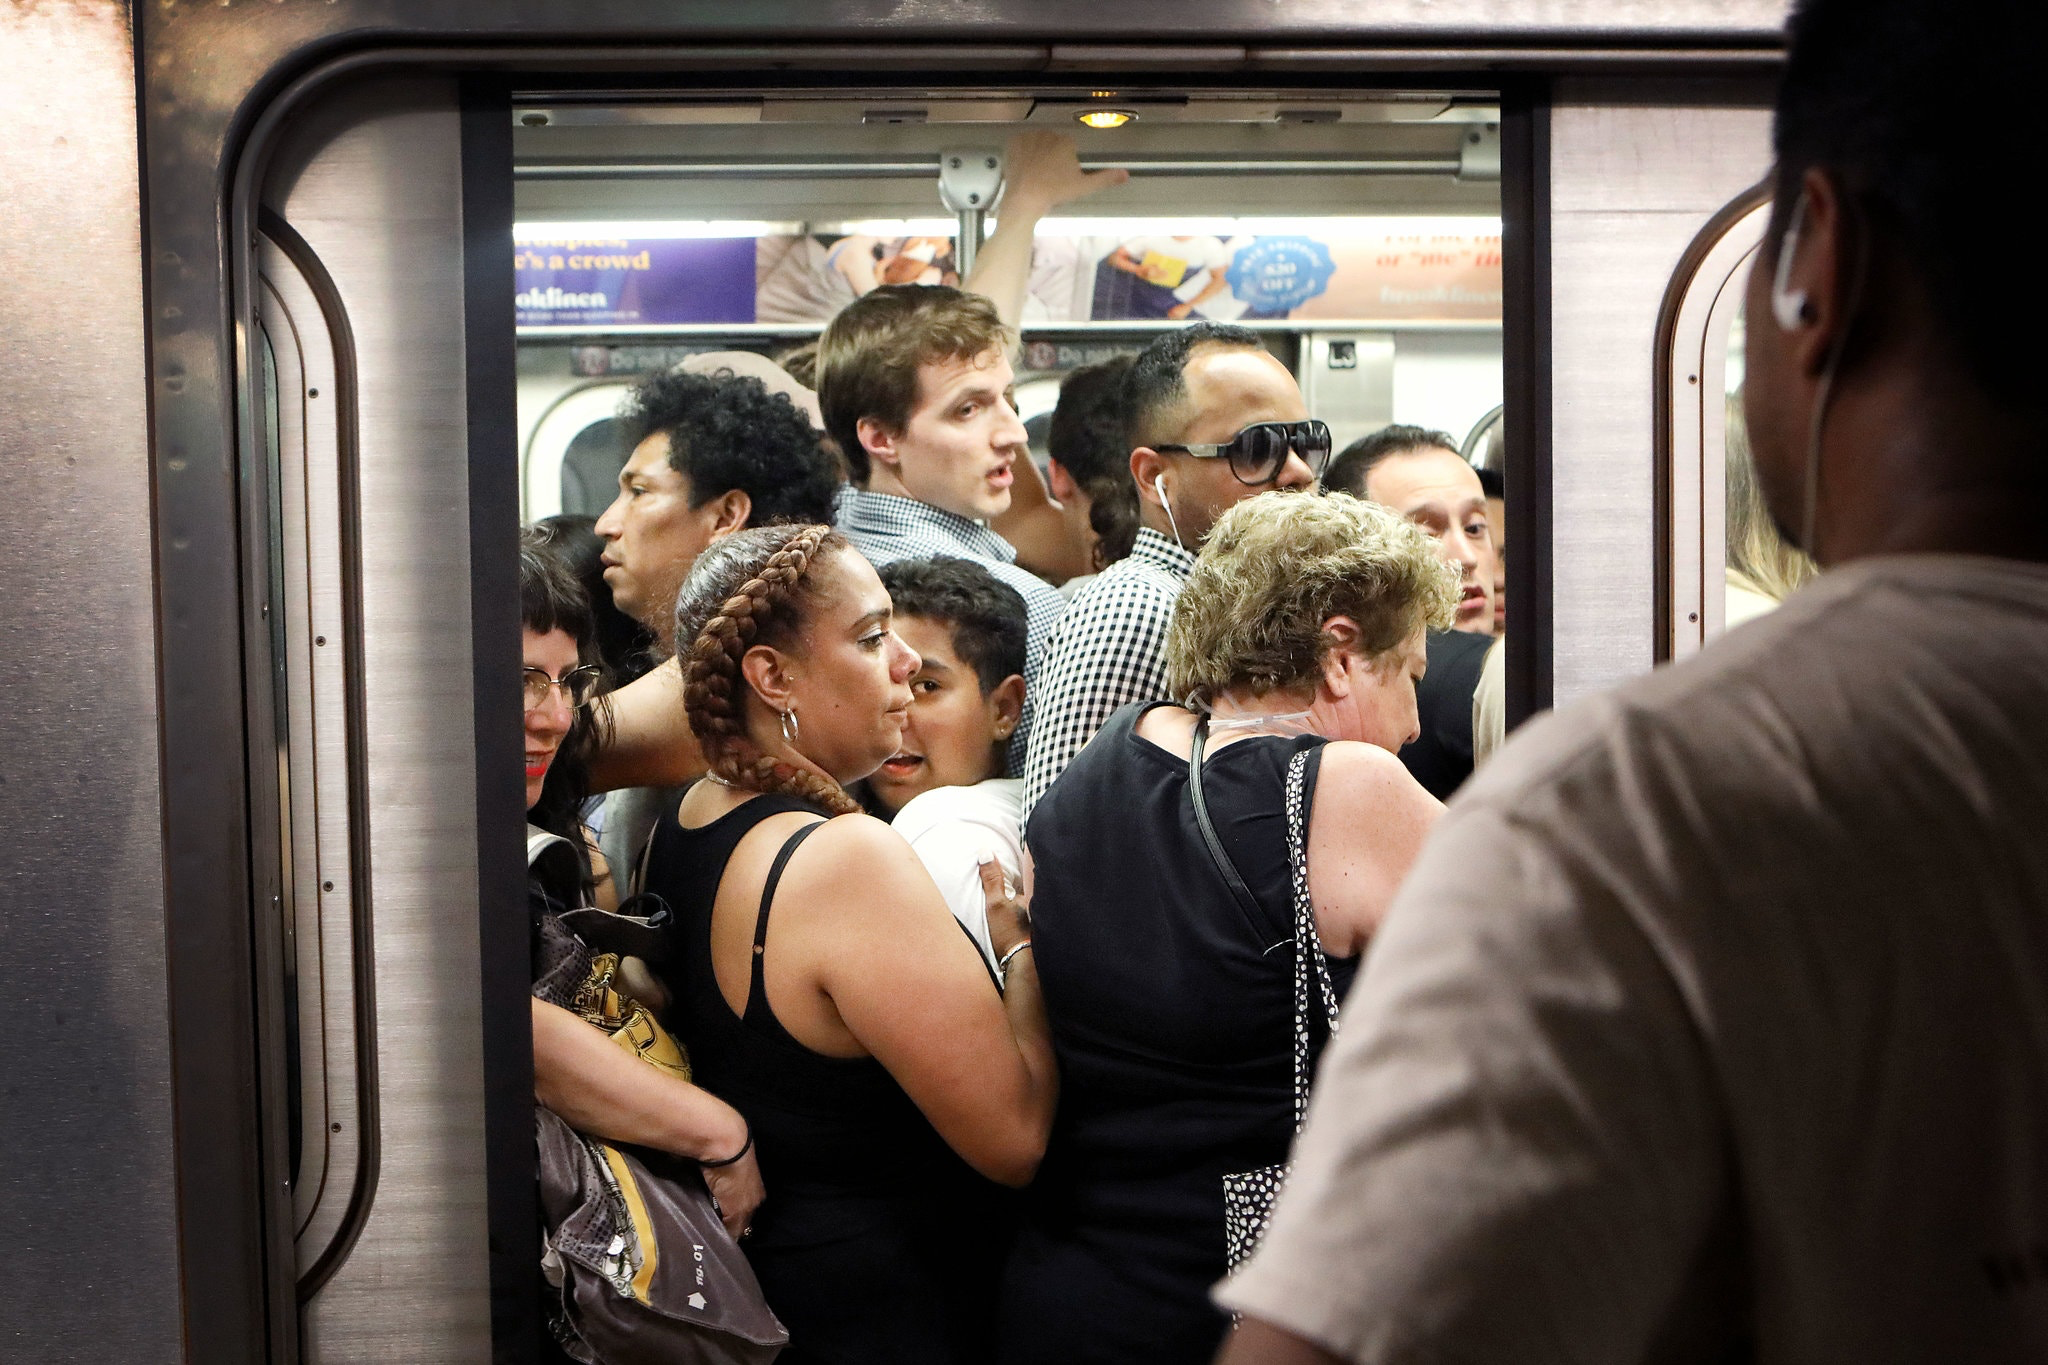
Nothing screams unavoidable proximity quite like public transportation at rush hour. With governments around the country easing up on stay-at-home orders, Americans seem to be returning to their cars with enthusiasm. The future for mass transit may be less rosy. Ever try social distancing on a crowded subway car?
Mobility data made available by Apple and Google tell an interesting story about the changes in patterns of transportation use over the course of the pandemic. Each data set offers a different perspective. Apple has extracted the relative number of requests for directions for different modes of transportation. Google focuses on the time spent at various locations over the course of the pandemic. Each data set paints a different picture, but both show dramatic decreases in mobility during the pandemic throughout the world.
Apple Mobility- Direction Requests
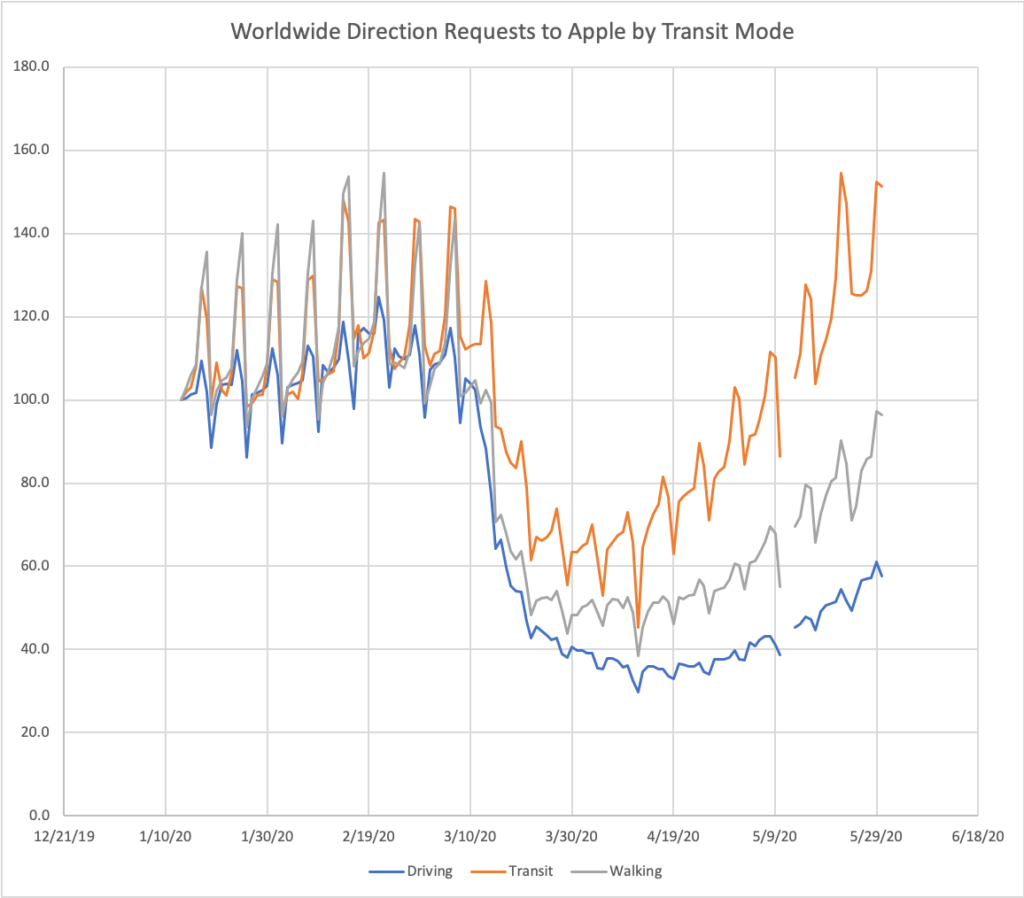
The Apple Mobility Data show that, worldwide, direction requests for all modes of transport nosedived with the introduction of stay home orders. Driving and walking dropped fell to about 60% below baseline (set arbitrarily as January 14) and transit (trains, buses, and subways) dropped to almost 70% below baseline.
The interesting story is the recovery. Driving is now hitting peak values more than 40% above baseline and walking is up close to baseline levels. Mass transit direction requests are still 40% below the January baseline.
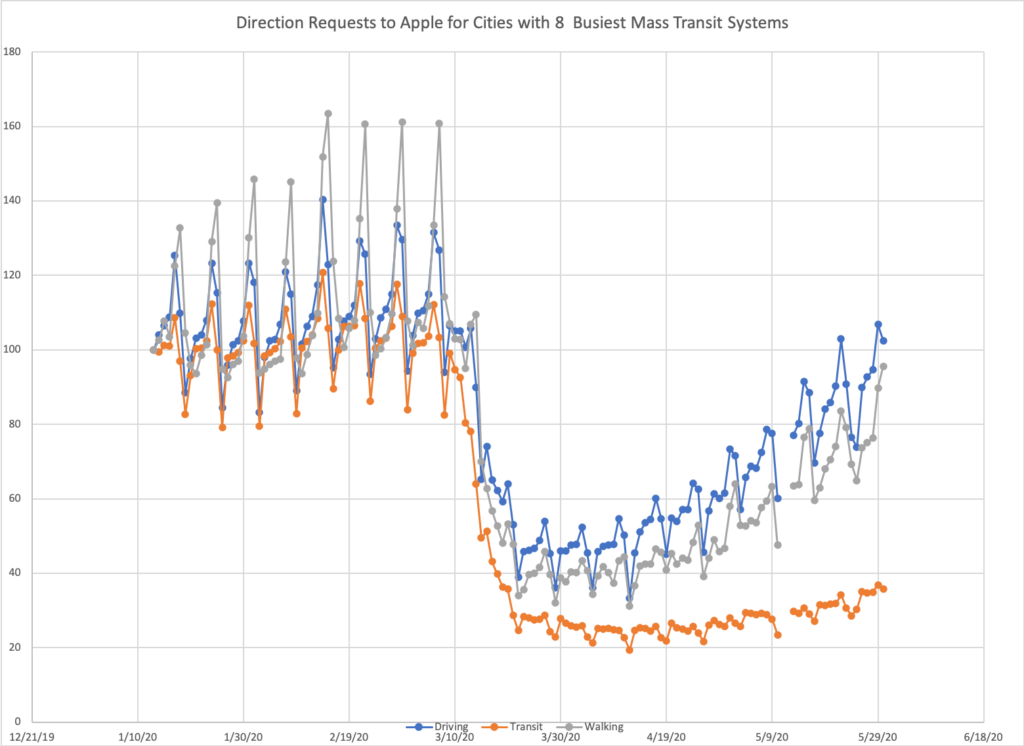
If we look at large cities in the US with heavy mass transit ridership, the story gets worse. The figure below shows direction requests in the eight US cities with most mass transit passenger miles, (Atlanta, Boston, Chicago, Los Angeles, Miami, New York City, Philadelphia, and San Francisco – Bay Area). As driving and walking approach baseline levels, mass transit is still down more than 60%. New York, with the most extensive and heavily used mass transit system in the country, is even lower at almost 80% off baseline.
Google Time and Location Data
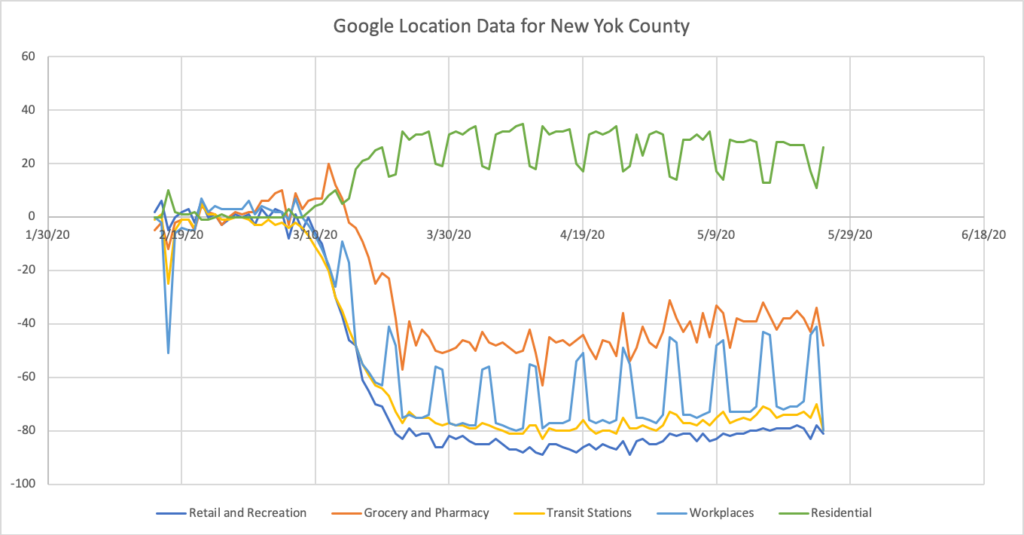
Google offers a different window into this story. Their data describe the amount of time users are spending at different locations including home, work, retail shopping, and grocery stores. In data from New York County shown below, a dramatic drop in time at the workplace was accompanied by a marked rise in time at home. The decrease in time spent at mass transit stops closely parallels the decline in time at work. This could mean that the persistent drop in mass transit use suggested by the Apple data might be nothing more than a simple reflection of the fact that many of us have not returned to our workplaces.
The question then becomes, will we ever look at a crowded subway car in quite the same way again? As people return to work in the weeks and months ahead, will they get there by mass transit? How will we make mass transit safe in the COVID-19 era? Perhaps people will insist on the safety of driving their own car, despite the rise in traffic that would bring. Or has the pandemic proven the viability of working from home?
The answers to these questions could have huge implications for the fate of mass transit. Planners and public health experts need to be working hard to make trains, subways, and buses safe. A major rise in personal automobile use due to concerns about the risk of infection on mass transit will increase fossil fuel consumption at a time when we should be doing the opposite. The changes wrought by the pandemic have yet to play out, but they may have major implications for climate change. That crisis is likely to make COVID-19 look like a minor skirmish in the larger War on Science and in the need for fundamental changes in our daily lives. We should all work to ensure that our response to a single virus does not make that next, far larger crisis worse.
